GPM offers web access to your flow, sample and rain event data on our server using the Teledyne ISCO Web UI “Flowlink Global”. Using hardware we provide and install at your site, the stored data is pushed to the server at user programmable intervals. Multi-level password protection, Web access and alarm set points are user configured to meet your requirements.
Browser based access makes it easy to view your data wherever you have internet access. This offered service not only provides easy access to your data but also prompt alarms on conditions you configure. False high or low flows can be caught right away and addressed.
While Flowlink configures devices and analyzes site data, Flowlink Global provides an easy-access portal that enables the user to view, organize, report and export site and device data. However, Flowlink Global is not just about passive viewing.
Flowlink Global allows monitoring of incoming data to ensure sites/devices are functioning properly. Flowlink Global collects and displays site and device alarms to show you where your attention is needed most. Clearing of an alarm is as easy as a click of a button.
Flowlink Global centralizes your flow data to a web site that is accessible by PCs and mobile devices. The Web Ul provides comprehensive monitoring, as well as far ranging portability. This Web Ul can run on Windows or iOS operating systems and a variety of web browsers: Internet Explorer, Safari, Google Chrome, Mozilla Firefox and Opera.
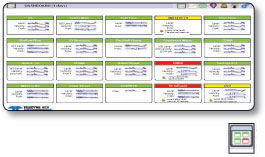
The Dashboard Page is an overview of the sites' flow data activity. Quick-view of alarm status, and display data summaries of monitored sites. When an alarm is present. the colors indicate the alarm status and alarm details.
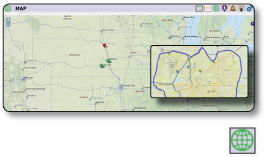
The Map Page shows the locations for monitored sites as well as alarm status by color. View maps in either ‘satellite view‘ (topography) or "streets view”. Site information and site data overlays the site pin marker.
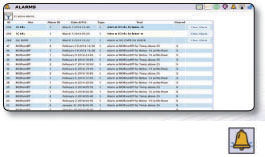
The Alamts Page shows a detailed list of site device generated alarms. View all alarms at once or alter them to see active alarms. Clear alarms with the click of a button.
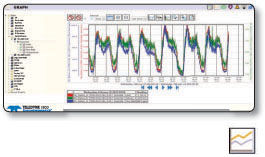
The Graph Page displays data sets in graph format (linear and scatter).
○ Populate the graph with multiple data sets and data types.
○ Use templates to quickly and easily select multiple graph settings (sites, devices, data types and the time interval). The SMART graph templates maintain consistent and quick retrieval of available site data.
○ Use the Save Graph function to save settings displayed in the graph. Reopening a saved graph automatically updates plots with the latest data.
○ Click the Report button to generate and export a report based on the graph data sets.
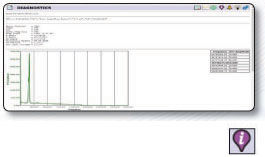
The Site Information Page displays all available information about the site such as devices installed, graphs, alarms, location, diagnostics, device generated information and more.
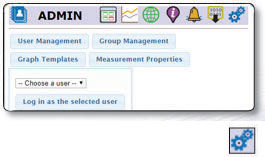
The Group and User Administrative options give user privileges and display properties. The administrator can selectively assign user access to sites and data types.